
1
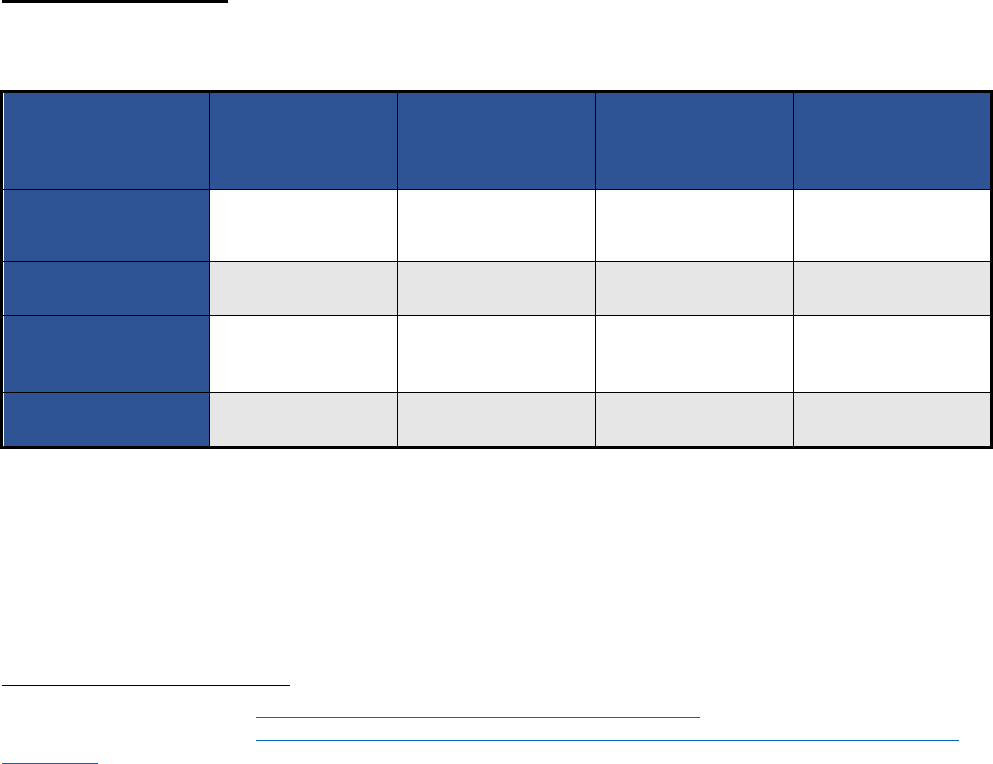
Appendix I: National Averages for Select Zip Codes
All figures are based on data provided to the Committee by the five companies that received our survey.
Calculations have not yet been verified and may be subject to adjustment. Unless otherwise stated, data
in the below graph is the total over time using quarterly measurements from March 31, 2018 – September
30, 2021.
American
Homes for Rent
Amherst
Residential
FirstKey
Homes
Invitation
Homes
Progress
Residential
Total
Total
Properties – at
Q3 2021
56,077 33,219 35,899 83,512 71,930
280,637
# Properties
Purchased
5,180 24,678 25,917 8,745 47,332
111,852
# Properties
Sold
3,435 21,306 1,798 8,579 409
35,527
Net Property
Gain
1,745 3,372 24,119 166 46,923
76,325
Value of Bonds
& Other
Financial
Instruments
Offered to
Investors
$1.7 Billion $6.6 Billion $.6 Billion $.5 Billion $16.4 Billion
$24.7 Billion
Average
% Net Property
Growth Q1
2018 – Q3
2021
3.11% 10.15% 67.19% 0.20% 65.23%
27.20%
% Properties
Purchased in
Bulk Sales
25.40% 16.70% 20.90% 11.00% 35.70%
21.90%
% Sold in Bulk
Sales
34.00% 98.00% 62.70% 26.90% 86.10%
61.50%
% Sold to
Leaseholders
0.30% 0.00% 0.20% 1.60% 0.20%
0.50%
2
Appendix II: Census Data for Select ZIP Code Tract Areas (ZCTAs)
Note: Data used for these analyses is from two sources: 1) American Community Survey (ACS) 5-year
(2016-2020) data at the ZIP Code Tract Area (ZCTA) level and 2) the five companies that received the
Committee’s survey. ACS 5-year data is collected over the course of the 5-year period in question and
provides a period estimate.
1
Number of ZCTAs higher and lower than the national average was calculated
using 90% confidence intervals for both the national average and ZCTAs. Number of higher and lower
ZCTAs indicates the number of ZCTAs whose confidence intervals do not overlap with that of the national
average. Confidence intervals were provided by the ACS for all categories except for those related to
family type. Family type confidence intervals were calculated via Successive Difference Replication using
ACS variance replicate estimates.
2
Calculations have not yet been verified and may be subject to
adjustment.
The number of ZCTAs higher and lower than the national average is out of 100 ZTCAs; the top 20 for
each company.
Demographic Data
Race
Company National Average
Average for
Company’s top 20
ZCTAs
# ZCTAs Higher
Than National
Average
# ZCTAs lower
than National
Average
% Population One
Race - Asian
5.6% 3.4% 6 68
% Population One
Race - Black
12.6% 40.2% 79 14
% Population -
Hispanic or Latino
of any race
18.2% 12.8% 14 73
% Population One
Race - White
70.4% 47.8% 18 78
1
United States Census Bureau, American Community Survey 5-Year Data (2009-2020), (Mar. 2022).
2
United States Census Bureau, Calculating Margins of Error the ACS Way: Using Replicate Methodology to Calculate
Uncertainty, (Feb. 2020).
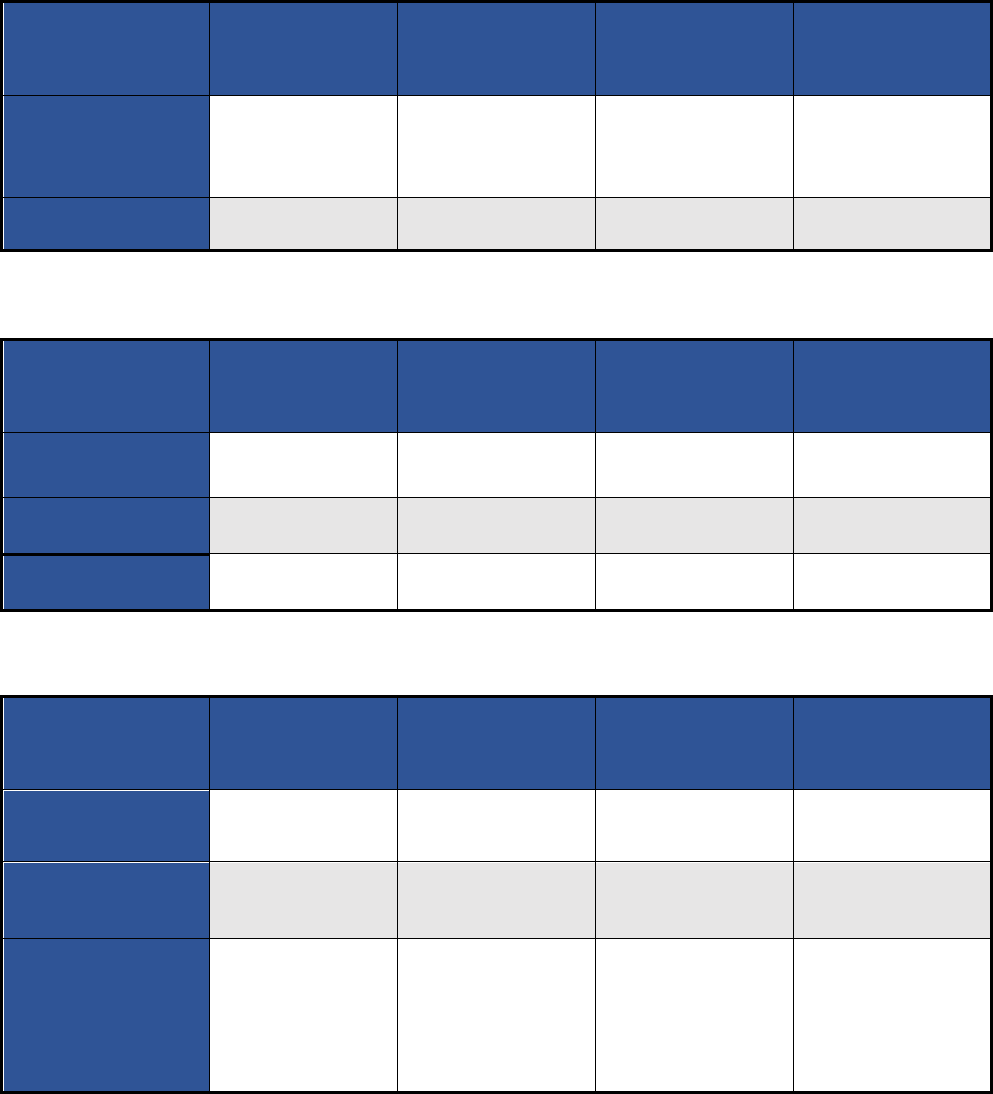
3
Language and Nationality
Company National Average
Average for
Company’s top 20
ZCTAs
# ZCTAs Higher
Than National
Average
# ZCTAs lower
than National
Average
% People > Age 5
Who Speak English
Less Than Very
Well
8.2% 6.2% 14 72
% Born in the
United States
84.9% 86.7% 60 18
Age
Company National Average
Average for
Company’s top 20
ZCTAs
# ZCTAs Higher
Than National
Average
# ZCTAs lower
than National
Average
Median Age 38.2 35.4 6 69
% Population Under
18
22.4% 26.4% 79 0
% Population Over
65
16% 11.0% 1 89
Family Status
Company National Average
Average for
Company’s top 20
ZCTAs
# ZCTAs Higher
Than National
Average
# ZCTAs lower
than National
Average
% Married Couple
Family
74.0% 68.6% 22 47
% Other Family
(i.e., Not Married-
Couple Families)
26.4% 31.5% 48 21
% Female
Householder, No
Spouse Present,
Own Children of the
Householder Under
18 Years
9.8% 12.9% 41 12
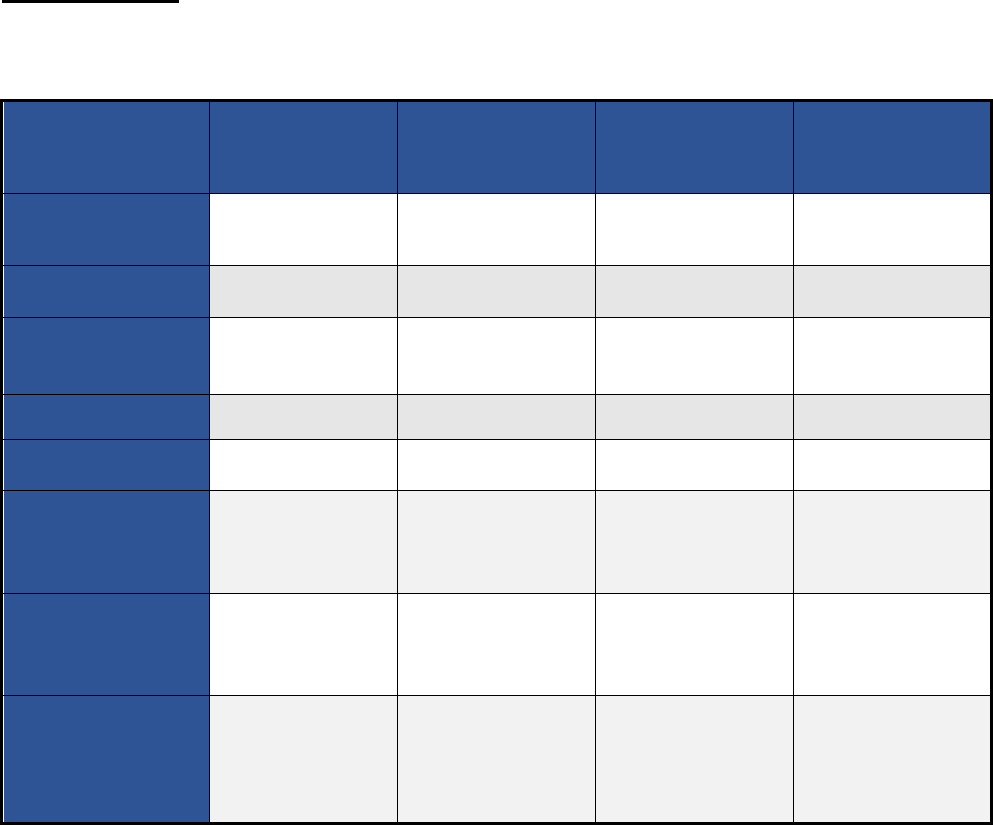
4
Income Profile
Income
Company National Average
Average for
Company’s top 20
ZCTAs
# ZCTAs Higher
Than National
Average
# ZCTAs lower
than National
Average
Median Household
Income $
$64,994.00 $68,833.75 47 33
Mean Household
Income $
$91,547.00 $83,187.48 17 62
% Of Households
Reporting
Household Earnings
77.7% 84.8% 87 1
Mean Earnings $ $93,265.00 $82,090.61 12 68
% Households With
Social Security
31.4% 24.5% 3 80
Mean Social
Security $ Among
Households that
Receive It
$20,126.00 $19,757.73 14 53
% Households With
Food Stamp/SNAP
Benefits in Past 12
Months
11.4% 10.8% 22 47
% Non-
Institutionalized
Population Without
Health Insurance
Coverage
8.7% 11.1% 54 12
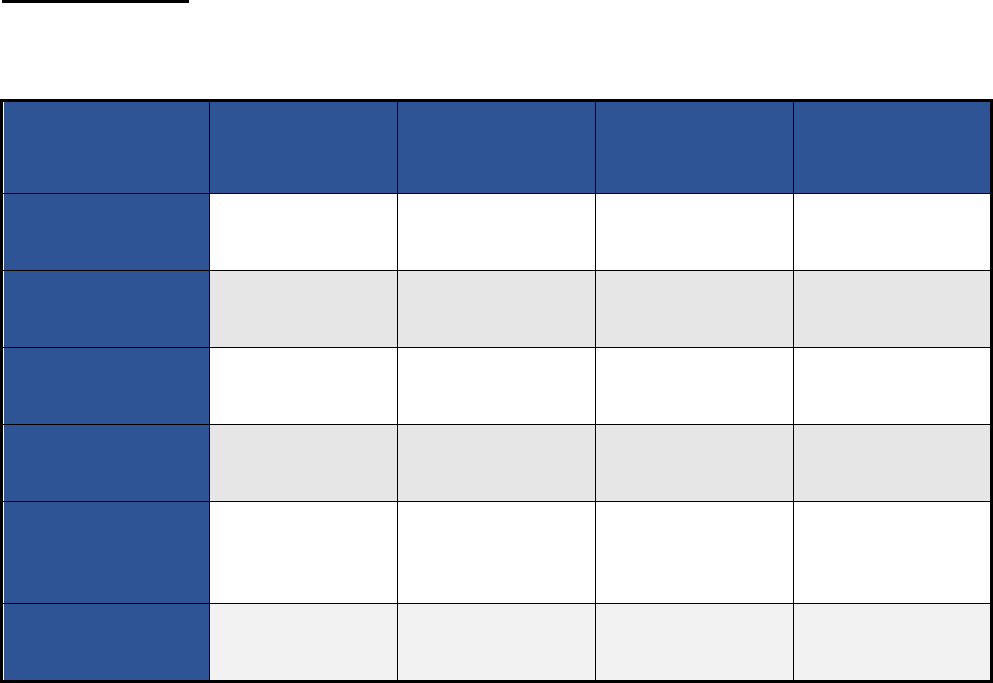
5
Housing Profile
Housing Profile
Company National Average
Average for
Company’s top 20
ZCTAs
# ZCTAs Higher
Than National
Average
# ZCTAs lower
than National
Average
% Occupied
Housing Units
Owner-Occupied
64.4% 68.6% 51 25
% Occupied
Housing Units
Renter-Occupied
35.6% 31.4%% 25 50
Owner-occupied
Units Median Value
$
$229,800.00 $198,766.00 20 74
Median Gross Rent
Among Occupied
Units Paying Rent $
$1,096.00 $1,259.34 75 15
% Occupied Units
Paying Rent Using
30.0% to 34.9% of
Income
9.1% 9.9% 7 10
% Occupied Units
Paying Rent Using
35.0% of Income
40% 39.2% 17 19
6
Appendix III: Annualized Data for Five Companies
Note: Data used for these analyses is from the five companies who received the Committee’s survey. Data
is for each company’s top 20 ZIP codes (for a total of 100 unique ZIP codes) by number of properties at
the end of Q3 2021 for all outcomes, unless otherwise stated. Calculations have not yet been verified and
may be subject to adjustment.
Note: Average total fees collected per lease, average late fees collected per lease, average leaseholder
income, total cost to leaseholders to initiate lease, percent of leaseholders in rent arrears, percent of
leaseholders in fee arrears, average time in days to complete maintenance requests, cumulative number of
eviction proceedings filed, and cumulative number of eviction proceedings completed were measured
quarterly from March 31, 2018 – September 30, 2021. Area mean income calculation data and graphs
were moving averages, such that each company provided information about the top 20 ZIP codes at the
end of each year from 2018 – 2020. Number of late rent payments received was measured monthly from
March 31, 2020 – October 31, 2021.
7
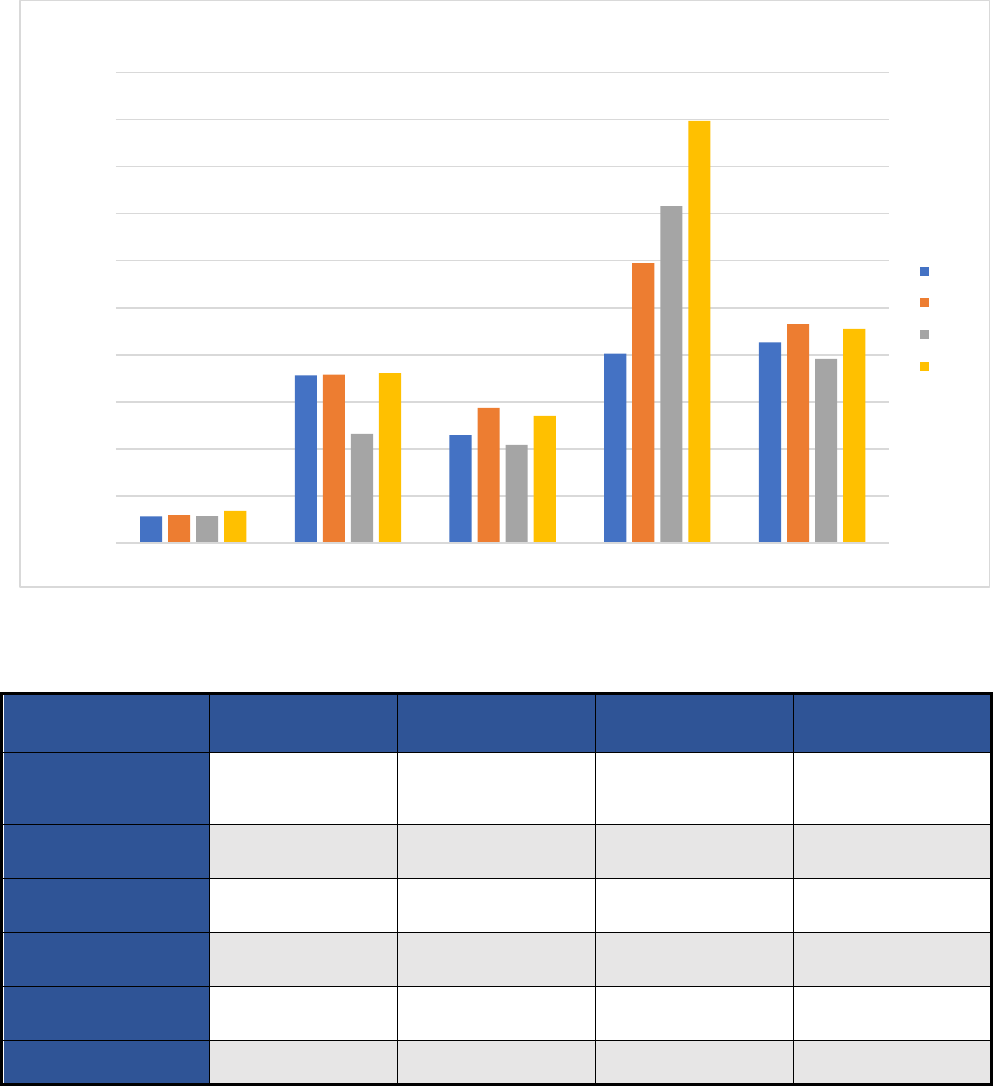
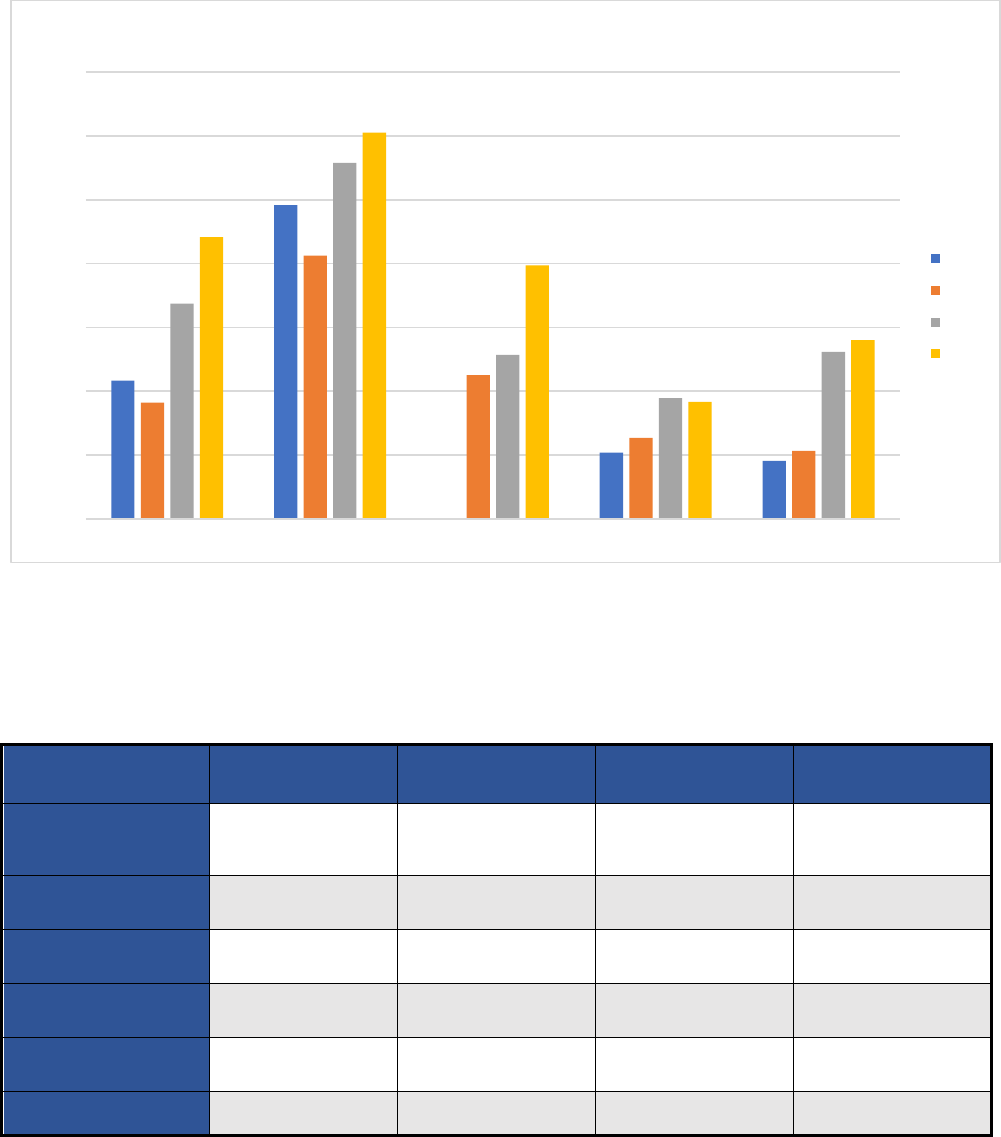
Average Total Fees Collected Per Lease
Company 2018 2019 2020 2021
American Homes 4
Rent
$28.42 $29.64 $28.68 $34.44
Amherst $178.16 $179.12 $116.17 $180.55
FirstKey Homes $114.86 $143.68 $104.44 $135.21
Invitation Homes $201.23 $297.69 $358.14 $448.57
Progress Residential $213.32 $232.73 $195.93 $227.66
Average $147.20 $176.57 $160.67 $205.29
$-
$50.00
$100.00
$150.00
$200.00
$250.00
$300.00
$350.00
$400.00
$450.00
$500.00
AH4R Amherst FirstKey Homes Invitation Homes Progress
Average Total Fees Collected Per Lease
2018
2019
2020
2021
8
$-
$20.00
$40.00
$60.00
$80.00
$100.00
$120.00
$140.00
$160.00
$180.00
$200.00
AH4R Amherst FirstKey Homes Invitation Homes Progress
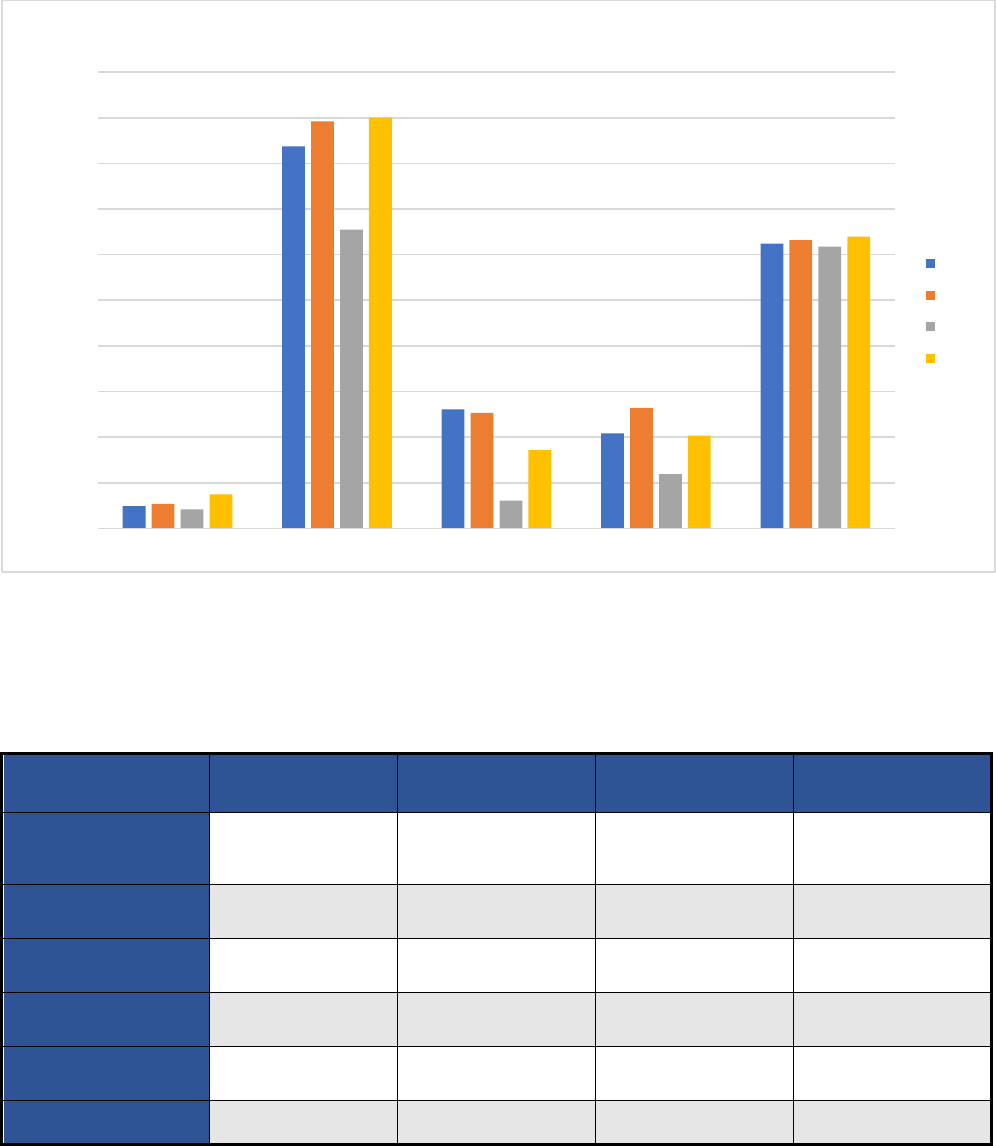
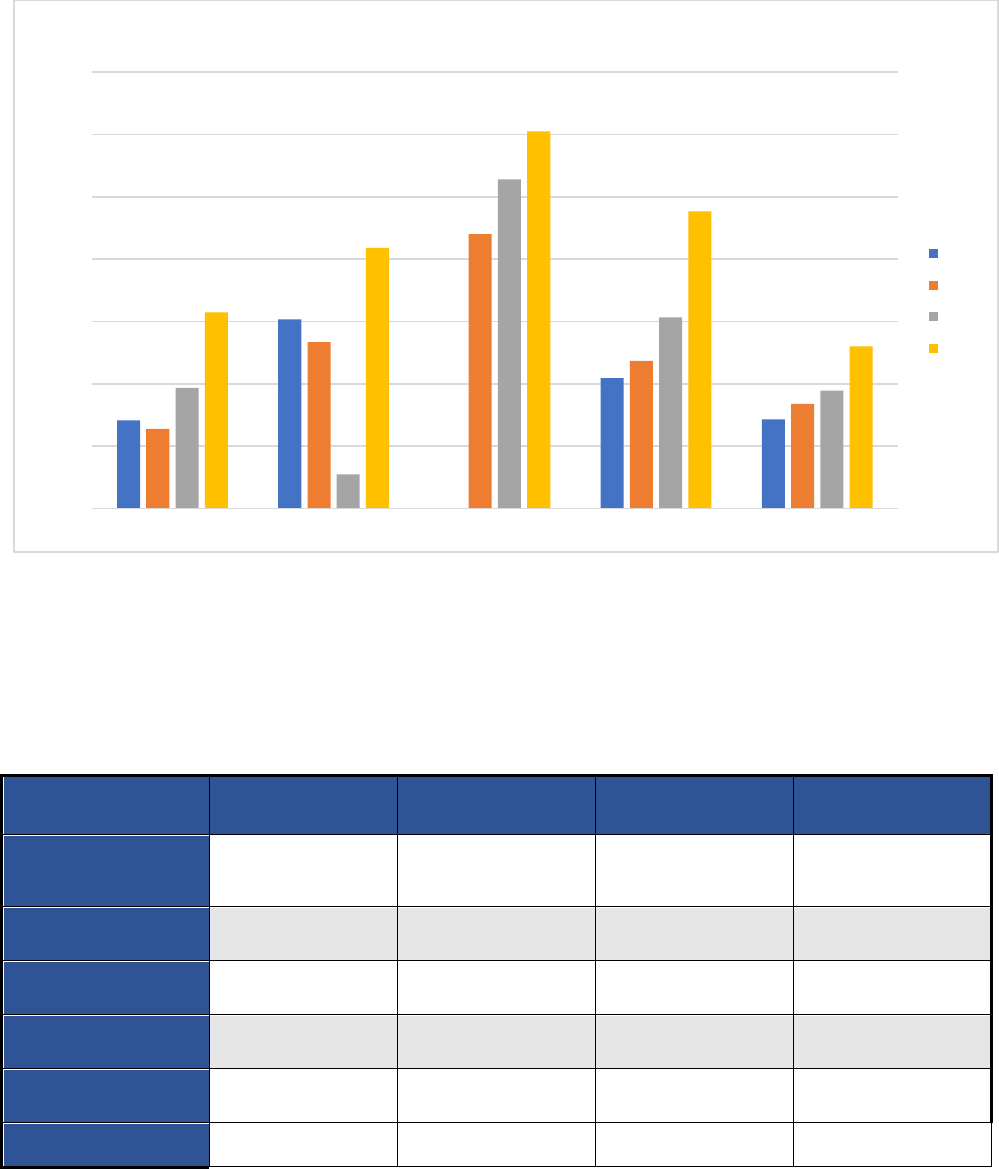
Average Late Fees Collected Per Lease
2018
2019
2020
2021
Average Late Fees Collected Per Lease
Company 2018 2019 2020 2021
American Homes 4
Rent
$9.76 $10.72 $8.38 $14.93
Amherst $167.54 $178.40 $130.93 $180.06
FirstKey Homes $52.14 $50.66 $12.19 $34.30
Invitation Homes $41.62 $52.85 $23.79 $40.61
Progress Residential $124.83 $126.33 $123.49 $127.96
Average $79.18 $83.79 $59.60 $79.57
9
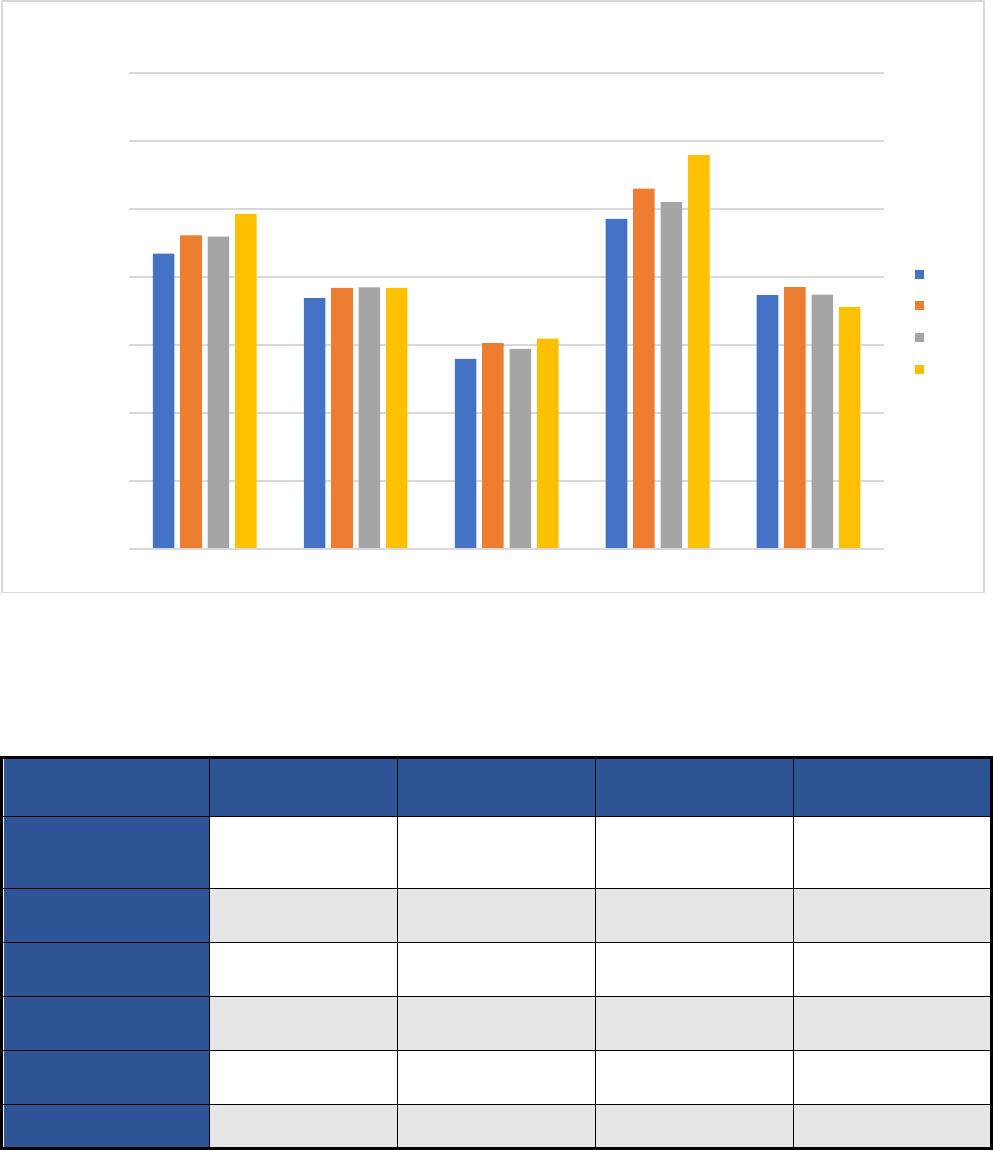
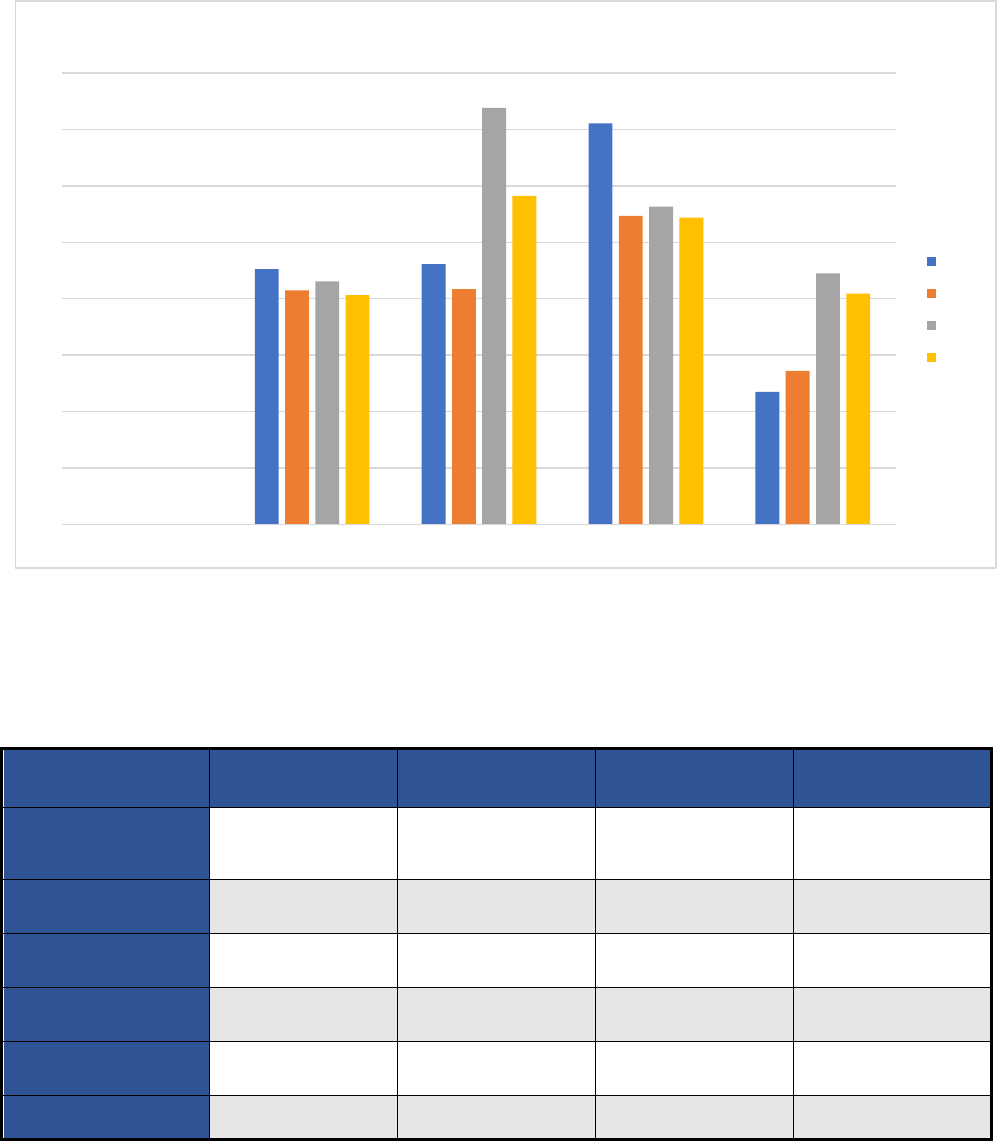
Average Leaseholder Income
Company 2018 2019 2020 2021
American Homes 4
Rent
$86,826.98 $92,210.00 $91,852.35 $98,587.21
Amherst $73,764.20 $ 76,787.55 $76,953.03 $76,782.58
FirstKey Homes $55,902.09 $60,528.04 $58,871.30 $61,846.73
Invitation Homes $97,060.01 $105,972.31 $102,013.64 $115,838.77
Progress Residential $74,619.90 $77,026.75 $74,786.65 $71,205.49
Average $77,689.11 $82,518.66 $80,895.39 $84,852.15
$-
$20,000.00
$40,000.00
$60,000.00
$80,000.00
$100,000.00
$120,000.00
$140,000.00
AH4R Amherst FirstKey Homes Invitation Homes Progress
Average Leaseholder Income
2018
2019
2020
2021
10
$-
$500.00
$1,000.00
$1,500.00
$2,000.00
$2,500.00
$3,000.00
$3,500.00
$4,000.00
$4,500.00
AH4R Amherst FirstKey Homes Invitation Homes Progress
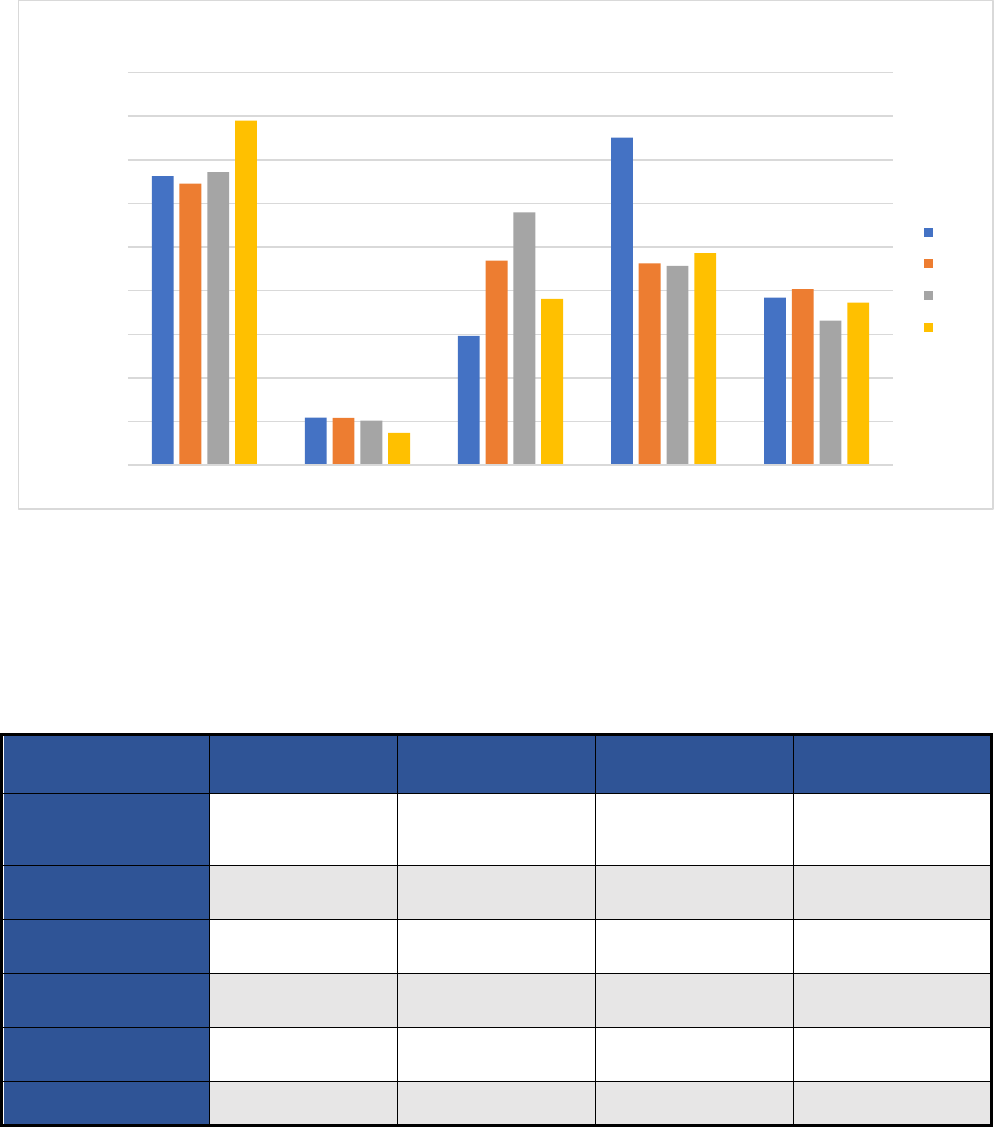
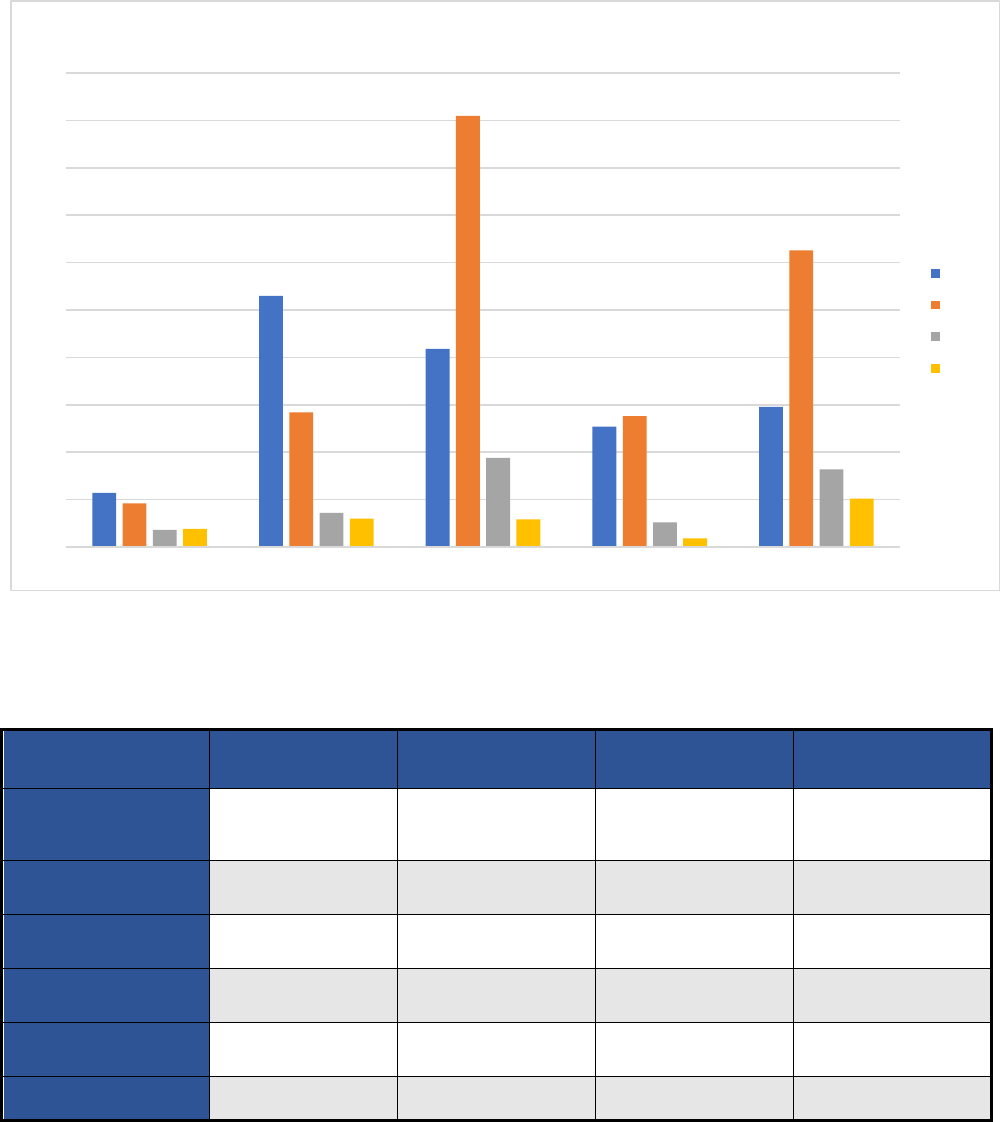
Total Cost to Leaseholders to Initiate Lease in Deposits, Fees, Etc.
2018
2019
2020
2021
Total Cost to Leaseholders to Initiate Lease in Deposits, Fees, Etc.
Company 2018 2019 2020 2021
American Homes 4
Rent
$3,312.78 $3,227.84 $3,358.79 $3,949.22
Amherst $544.10 $541.69 $511.24 $371.55
FirstKey Homes $1,482.76 $2,345.10 $2,897.87 $1,905.73
Invitation Homes $3,753.31 $2,311.46 $2,283.96 $2,431.53
Progress Residential $1,919.19 $2,017.80 $1,655.14 $1,863.02
Average $2,202.43 $2,088.96 $2,141.40 $2,104.21
11
0.0%
5.0%
10.0%
15.0%
20.0%
25.0%
30.0%
35.0%
AH4R Amherst FirstKey Homes Invitation Homes Progress
% Leaseholders in Rent Arrears
2018
2019
2020
2021
% Leaseholders in Rent Arrears
Company 2018 2019 2020 2021
American Homes 4
Rent
10.8% 9.1% 16.9% 22.1%
Amherst 24.6% 20.6% 27.9% 30.3%
FirstKey Homes N/A 11.3% 12.8% 19.9%
Invitation Homes 5.2% 6.3% 9.5% 9.2%
Progress Residential 4.5% 5.3% 13.1% 14.0%
Average 11.3% 10.5% 16.0% 19.1%
12
$-
$0.05
$0.10
$0.15
$0.20
$0.25
$0.30
$0.35
AH4R Amherst FirstKey Homes Invitation Homes Progress
% Leaseholders in Fee Arrears
2018
2019
2020
2021
% Leaseholders in Fee Arrears
Company 2018 2019 2020 2021
American Homes 4
Rent
7.1% 6.4% 9.7% 15.7%
Amherst 15.2% 13.3% 2.7% 20.9%
FirstKey Homes N/A 22.0% 26.4% 30.3%
Invitation Homes 10.4% 11.8% 15.3% 23.8%
Progress Residential 7.1% 8.4% 9.5% 13.0%
Average 10.0% 12.4% 12.7% 20.7%
13
0
2
4
6
8
10
12
14
16
AH4R Amherst FirstKey Homes Invitation Homes Progress
Average Time in Days to Complete Maintenace Requests
2018
2019
2020
2021
Average Time in Days to Complete Maintenance Requests
Company 2018 2019 2020 2021
American Homes 4
Rent
No data available No data available No data available No data available
Amherst 9.0 8.3 8.6 8.1
FirstKey Homes 9.2 8.3 14.8 11.6
Invitation Homes 14.2 10.9 11.3 10.9
Progress Residential 4.7 5.4 8.9 8.2
Average 9.3 8.3 10.9 9.7

14
0
500
1000
1500
2000
2500
AH4R Amherst FirstKey Homes Invitation Homes Progress
Cumulative # Eviction Proceedings Filed
2018
2019
2020
2021
Cumulative # Eviction Proceedings Filed
Company 2018 2019 2020 2021
American Homes 4
Rent
605 748 170 195
Amherst 1624 2108 589 755
FirstKey Homes 863 993 174 84
Invitation Homes 1087 1180 679 655
Progress Residential 733 1695 687 933
Sum 4912 6724 2299 2622
15
0
50
100
150
200
250
300
350
400
450
500
AH4R Amherst FirstKey Homes Invitation Homes Progress
Cumulative # Eviction Proceedings Completed
2018
2019
2020
2021
Cumulative # Eviction Proceedings Completed
Company 2018 2019 2020 2021
American Homes 4
Rent
57 46 18 19
Amherst 265 142 36 30
FirstKey Homes 209 455 94 29
Invitation Homes 127 138 26 9
Progress Residential 148 313 82 51
Sum 806 1094 256 138
16
0%
10%
20%
30%
40%
50%
60%
70%
AH4R Amherst FKH IH Progress
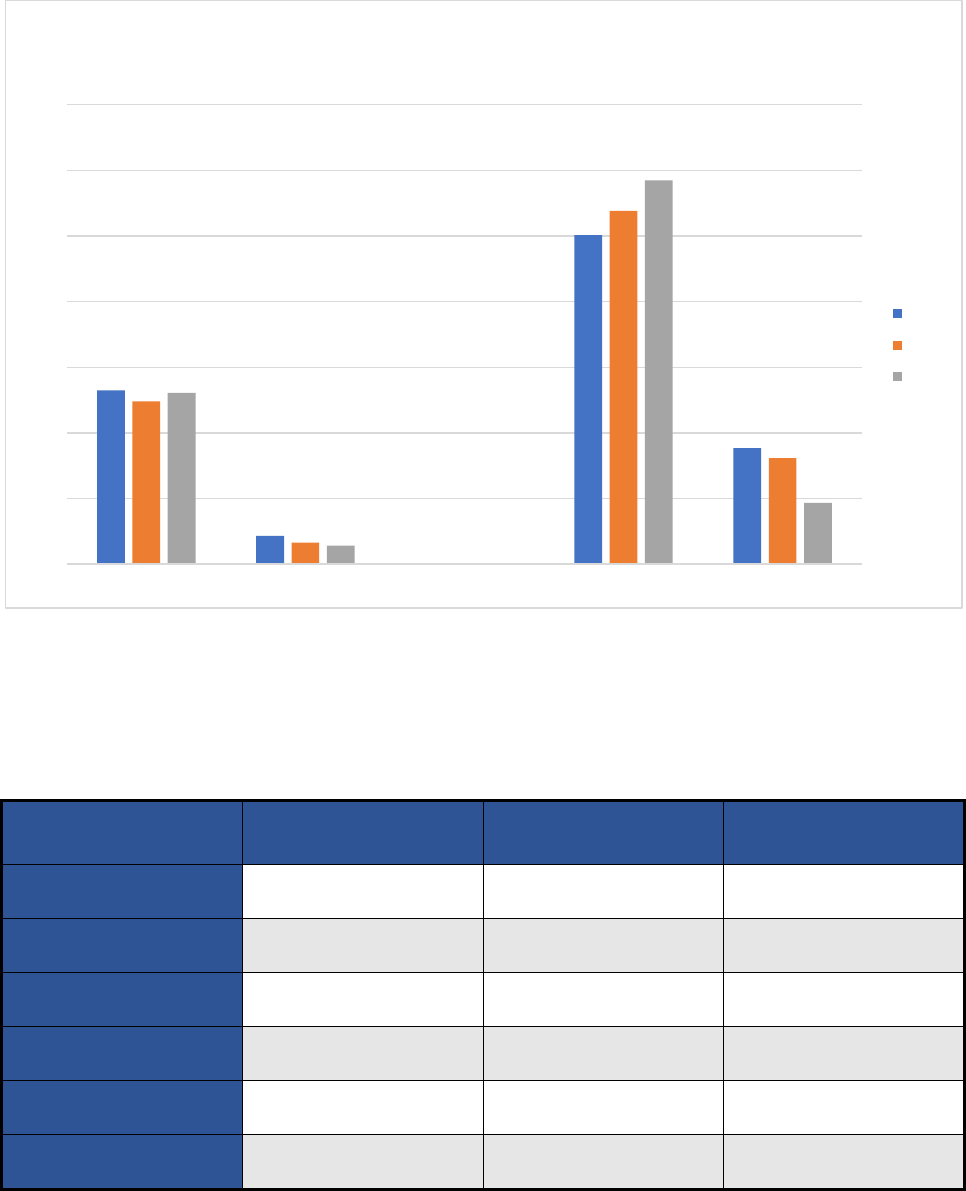
% Houses that Cost 30% or Less of Income for Individuals
Making Up to 80% AMI
2018
2019
2020
% of Houses That Cost 30% or Less of Income for Individuals Making Up To
80% AMI
Company 2018 2019 2020
American Homes 4 Rent 26.5% 24.8% 26.1%
Amherst 4.3% 3.3% 2.8%
FirstKey Homes No data provided No data provided No data provided
Invitation Homes 50.2% 53.8% 58.5%
Progress Residential 17.7% 16.2% 9.3%
Average 24.7% 24.5% 24.2%
17
0%
2%
4%
6%
8%
10%
12%
AH4R Amherst FKH IH Progress
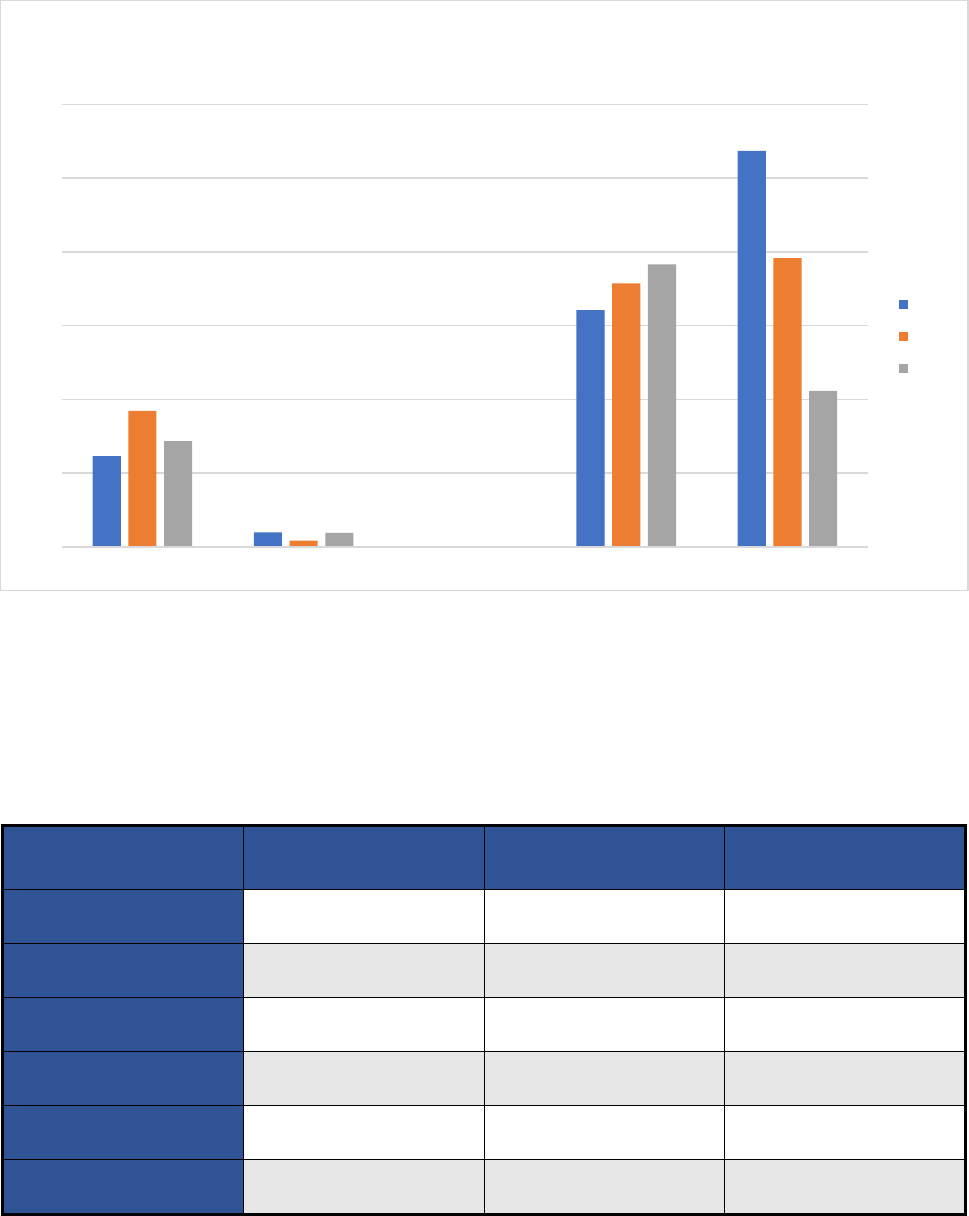
% Houses that Cost 30% or Less of Income for Individuals Making
Up to 60% AMI
2018
2019
2020
% of Houses That Cost 30% or Less of Income for Individuals Making Up To
60% AMI
Company 2018 2019 2020
American Homes 4 Rent 2.5% 3.7% 2.9%
Amherst 0.4% 0.2% 0.4%
FirstKey Homes No data provided No data provided No data provided
Invitation Homes 6.4% 7.1% 7.7%
Progress Residential 10.7% 7.8% 4.2%
Average 5.0% 4.7% 3.8%
18
0%
2%
4%
6%
8%
10%
12%
AH4R Amherst FKH IH Progress
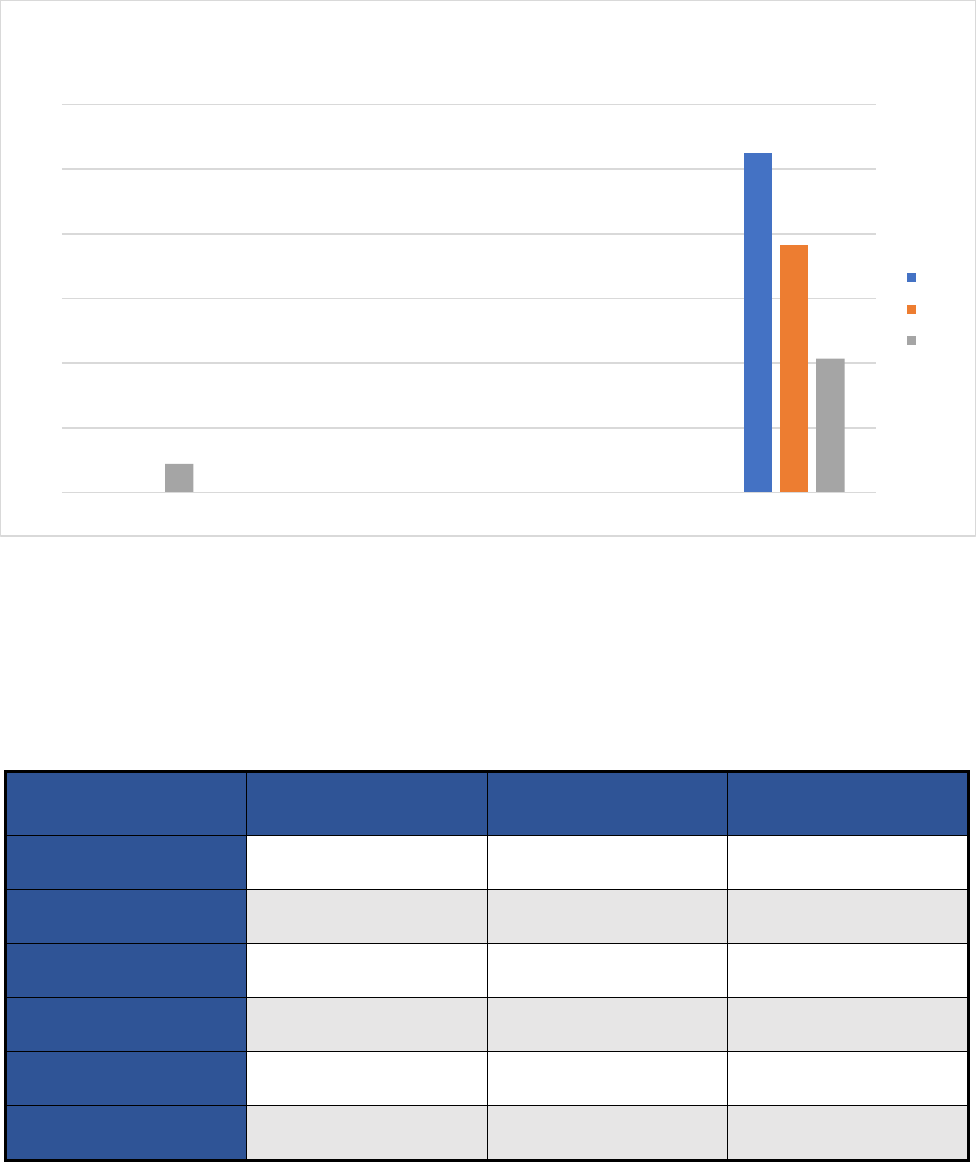
% Houses that Cost 30% or Less of Income for Individuals Making
Up to 30% AMI
2018
2019
2020
% of Houses That Cost 30% or Less of Income for Individuals Making Up To
30% AMI
Company 2018 2019 2020
American Homes 4 Rent 0.0% 0.0% 0.9%
Amherst 0.0% 0.0% 0.0%
FirstKey Homes No data provided No data provided No data provided
Invitation Homes 0.0% 0.0% 0.0%
Progress Residential 10.5% 7.7% 4.1%
Average 2.6% 1.9% 1.3%
19
Note: Invitation Homes answered N/A to this question for Q1-Q2 2018.
0
50000
100000
150000
200000
250000
2018 2019 2020 2021
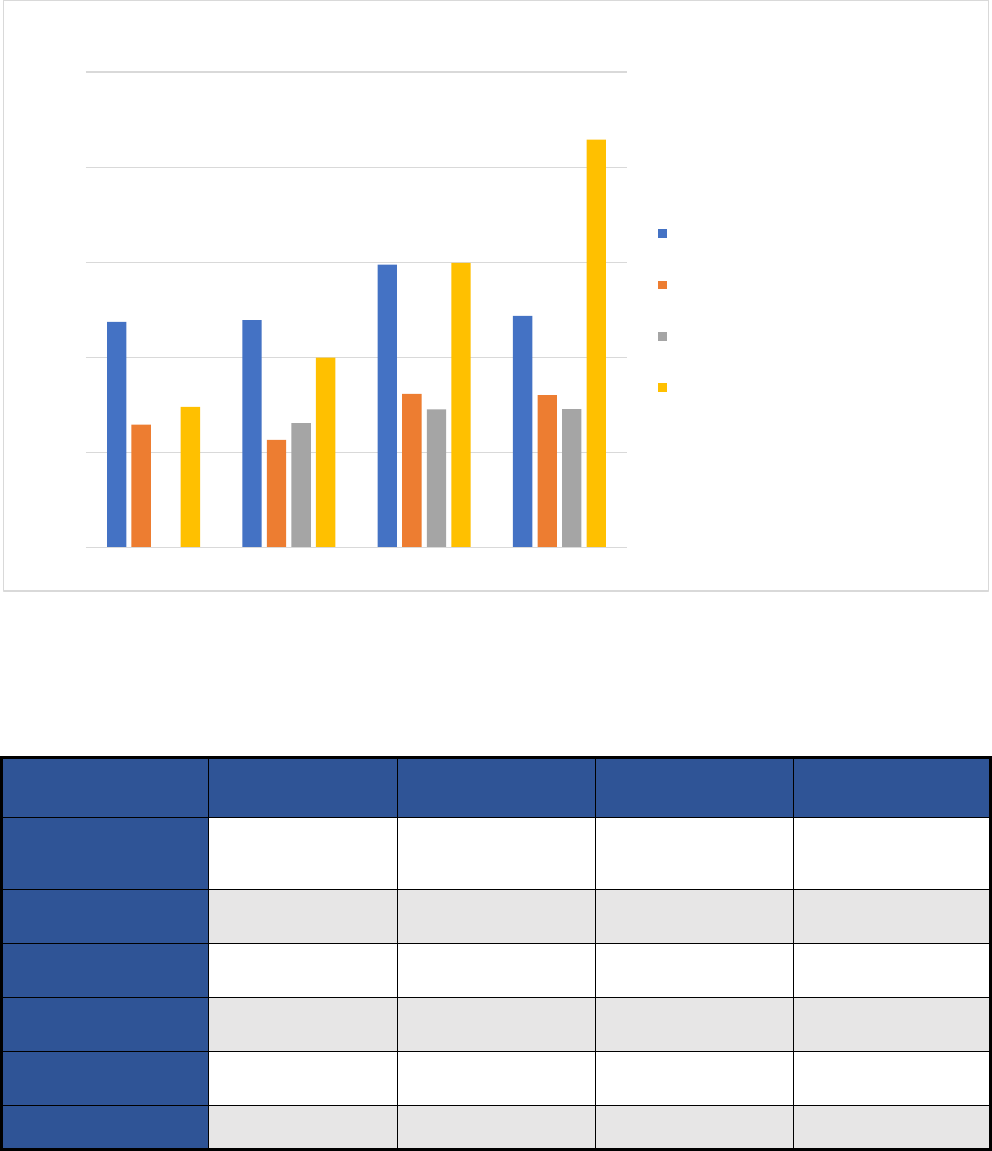
# Late Rent Payments Received
Sum of # Late Rent Payments Received -
AH4R
Sum of # Late Rent Payments Received -
Amherst
Sum of # Late Rent Payments Received -
FKH
Sum of # Late Rent Payments Received -
Progress
Total # Late Rent Payments Received
Company 2018 2019 2020 2021
American Homes 4
Rent
118,653 119,569 148,721 121,824
Amherst 64,563 56,629 80,781 80,171
FirstKey Homes 0 65,280 72,557 72,712
Invitation Homes 85,165 163,370 124,975 91,678
Progress Residential 73,945 99,778 149,744 214,515
Sum 342,326 504,626 576,778 580,900
20
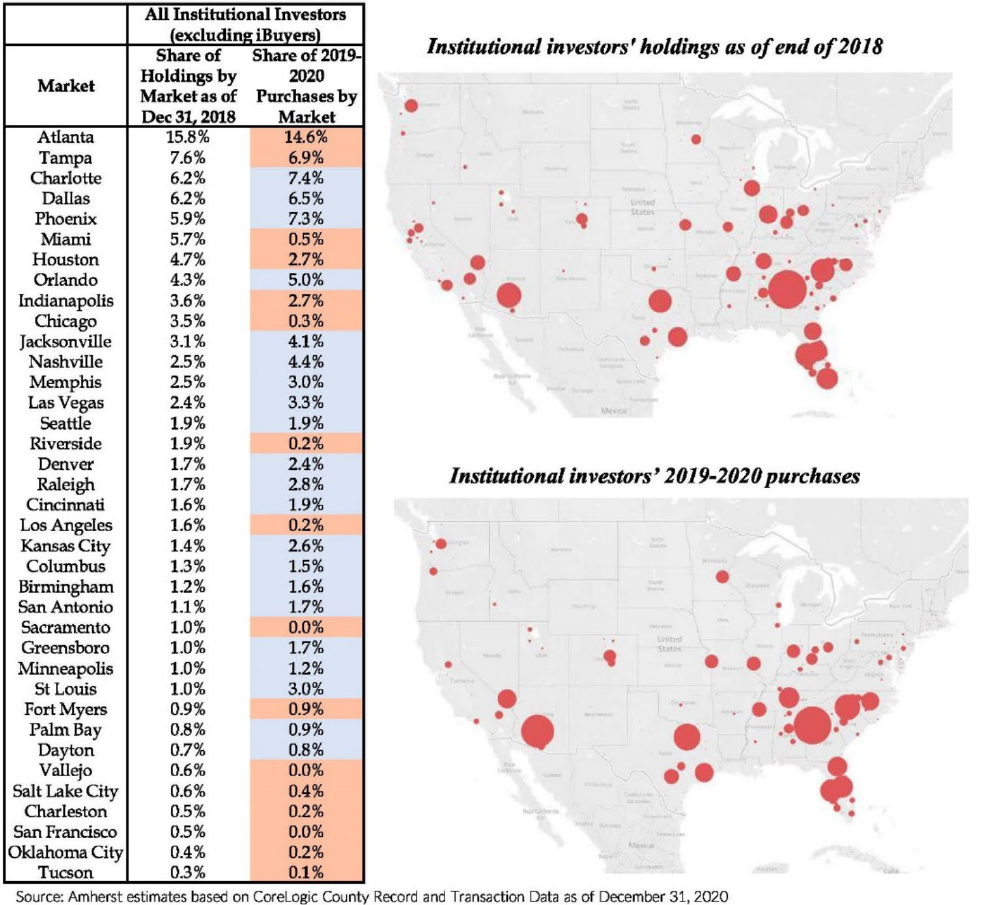
Appendix IV: Geographic Concentration of Institutional SFR Holdings
